eCourse Growth Strategies
Sell Your Knowledge Online: Fixing a Drop in eCourse Sales
Most course vendors will monitor their Conversion Rate (CR) each month and many eCourse sellers find that numbers stay surprisingly consistent. That being said, there is a natural rhythm or fluctuation that should be expected on a month to month basis. Most eCourse veterans are familiar and comfortable with these slight variations. For example, a CR of 1.1% this month and a CR of .08 next month probably isn’t the end of the world and won’t raise and flags. It’s likely just the natural rhythm of your eLearning site.
AN ECOURSE CASE STUDY
We love using case studies at Academy of Mine. All of you familiar with our edupreneur blog will know that we often post information about data collection and how eCourse sellers can use data to help them grow their course. However, data can be used for more than just growth, it can also be used to help identify and then fix any issues with regards to dropping eCourse sales.
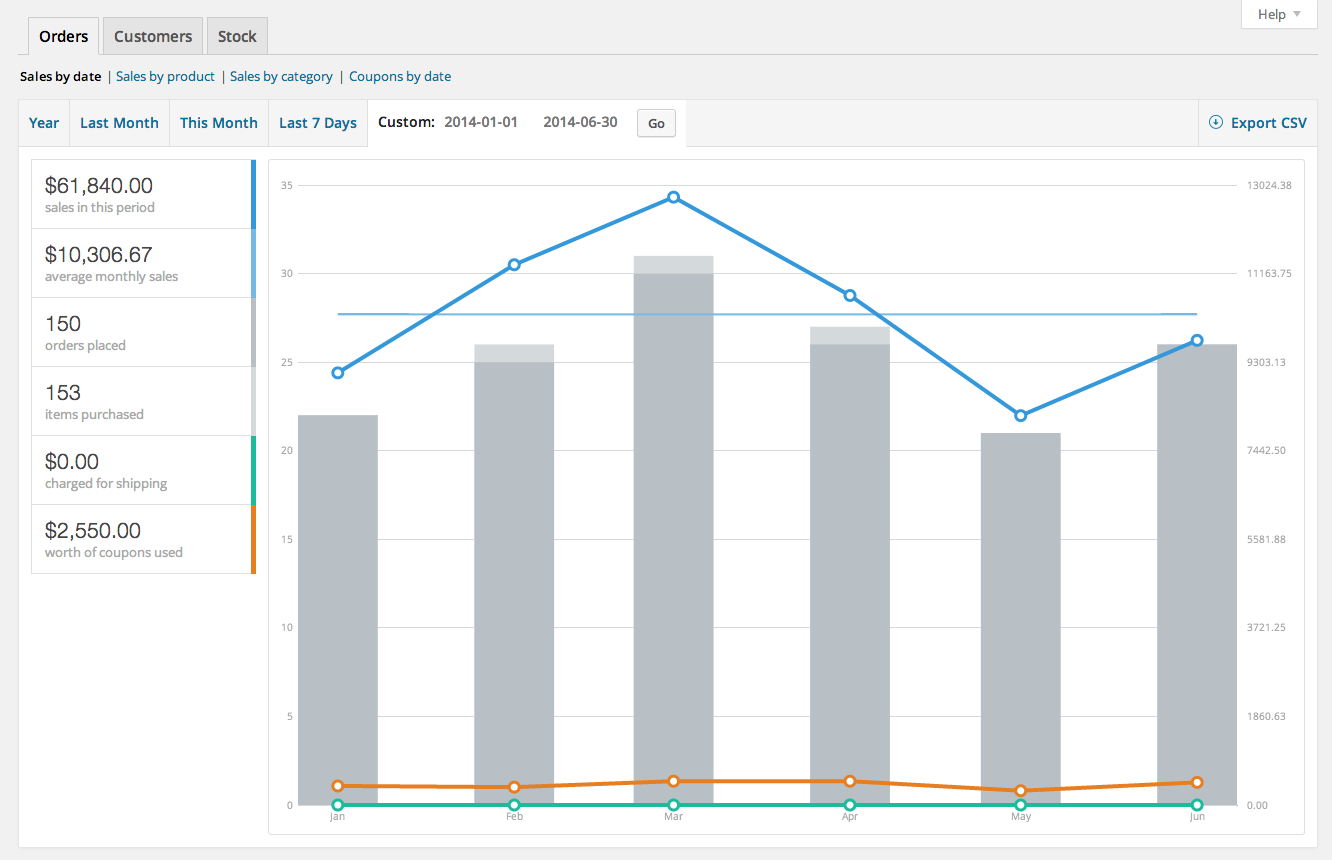
Let’s jump into this conversation by looking at one of our member’s sales graphs below. You’ll see they average $10,306.67 in eCourse sales / month. However, their sales range from about $7000 to 12,000 / month. Also notice in May there was a big drop in sales. Should they worry? I’m not sure… we have to dig deeper.
LET’S START BY LOOKING AT SALES
LOOKING AT SALES ALONE DOESN’T GIVE US THE WHOLE PICTURE.
Seeing a drop in sales doesn’t mean much unless you draw traffic into the equation. A drop in sales is nothing to worry about if a drop in traffic caused the problem (in that case, diagnosing the traffic loss is important because fixing the problem will simply mean fixing your traffic issue). Looking at the chart below you’ll see that May’s drop in sales had nothing to do with traffic as traffic remained fairly consistent.
BRINGING THE SITE’S CONVERSION RATE INTO THE PICTURE
We’re getting closer to a clearer picture if we have a problem on our hands here or if our member’s dip in May was simply part of the natural rhythm of their eLearning site. An easy metric to help you figure this out is your eCourse site’s conversion rate (CR). In this case study the member has a CR between 0.39% and 0.59 for these 6 months (which is low because they have a high priced online course). The numbers below represent numbers less than 1%. For example 48 means 0.48%. The average conversion rate for these six months was .46%. As you can see this member’s best month for sales was also their best month for traffic and also their best month for conversion rate. When we look at their lowest sales month (May) we see that it was also their lowest month in terms of CR (.39%). However, the fact that they jumped back up the next month gives us a bit of breathing room because .39% isn’t lower than the previous low month (which means it’s not out of the normal rhythm of the site). Take a look for yourself below.
BUT WHAT IF CR, TRAFFIC AND SALES WERE DIPPING
If you’re looking at your online course sales numbers and you see consistent dips outside of the normal rhythm of your eCourse site, first make sure that the dips are proportionate to dips in traffic or dips in CR. You need to be able to properly diagnose the problem by looking first at your data, before you can even think about a strategy for fixing the issue.
IF THE DIP WAS CAUSED BY A DECREASE IN TRAFFIC
If the decrease was caused by a decrease in site traffic the first thing you need to do is drill deeper and find more specific metrics. Site-wide traffic isn’t really the best indicator when looking for problems with sales. The reason is that you might have popular posts on your blog that may or may not have much impact on your bottom line. If a page that has little impact on your bottom line becomes popular in search engines you might see a jump in traffic and be surprised by the fact that it doesn’t have much impact on sales. In this case, looking at site-wide traffic stats will artificially deflate your CR which might make it look like you have a conversion problem when in fact the problem lays in developing a better content marketing strategy.
For this reason, it’s best just to tally up the unique visits to your eCourse landing pages (your main course sales page(s). This will give you a better indication of your most important site traffic. The traffic that either entered on one of your main landing pages, or was funnelled there by one of your blog posts.
If, after looking at this data, you find out that indeed your sales slump was caused by a substantial decrease in traffic you need to re-strategize your content marketing and general traffic campaign. We have a great post entitled Improving Search Ranking for eCourse Sellers that gives you one strategy on improving your search ranking for long tail search terms. We also have another post entitled eCourse Traffic Sources that Bring the Most Enrollments. There are, of course, thousands of other strategies. But those posts should help get you started.
IF THE DIP WAS CAUSED BY A DECREASE IN CR
If your traffic levels stayed consistent but your sales dropped due to a decrease in your eCourse site’s conversion rate, then you need to strategize differently. There are a few things you can do if you find this to be the issue:
1: Source of traffic: Different traffic sources have a different impact on CR. Some referral sources just convert better. So even if traffic remained consistent, you need to dig deeper to see if you lost a high quality referral partner, or started ranking lower for one of your better converting search terms and maybe higher for a lower converting search term.
2: Competition: If you’ve looked at the data above but you don’t find any major changes in your site’s traffic sources then you might need to do some basic research to see if you have a new competitor. You might be sharing your niche’s market share with another company that you were not aware of. Are they offering a superior product or offering a similar online course at a lower price point? This could be the reason for your drop in sales.
3: Outdated Site: Another reason that you might be seeing lower sales numbers is because over the years your eLearning site may have started to look outdated. Site aging is a natural process but requires your attention once in a while. Sometimes a decent design update is enough to jolt your site back up to normal sales levels.
CONCLUSION
In the end, it’s up to you to 1) find out if you have a problem or if the drop in sales in part of your eCourse site’s natural rhythm 2) Properly diagnose the problem by identifying what’s contributing to the dip in sales and lastly 3) Implement a strategy.