eCourse Growth Strategies, EdTeach: Tools & Tutorials, Edupreneurs
Online Course Content Marketing: What is the Value of a Post?

The intersection of data and content marketing
In many cases a strong content marketing campaign is responsible for helping our online course selling members generate between 70% – 90% of their eCourse sales. Therefore we believe it’s of paramount importance to spend some time digging around in the data related to your content marketing campaign in order to help you identify what’s working… and what’s not.
eCourse sellers often mistakingly think that all content is created equal if it’s targeted towards their specific niche. However, nothing could be further from the truth. And we have data… and lots of it, to help us prove our point.
Essentially, this misguided thinking goes something like this: Let’s say, for example, that an eCourse seller published 10 posts in one month and each posts gets 100 unique views that month (equalling 1000 views / month). And let’s say that during this month they made 10 eCourse sales (1% CR).Therefore, they might give equal credit to all posts and pages that helped them generate those sales. They might even have a nice little metrics spreadsheet where they can mark down that they received 1000 unique visitors, 10 sales and a 1% eCourse conversion rate. Simple enough right?
They might even use the exact same content marketing strategy next month. It worked this month, so why not use it again next month? As the old adage goes “if it’s not broke, why fix it?”
Because if you look closely you’ll see that it’s sort of broken
It’s true that you could use the same content marketing strategy month after month. And the truth is that you might even do well. But if you’re not using data to make content creation and marketing decisions then you’re not even close to realizing the full financial potential of your eCourse company.
This is where Academy of Mine members have a huge edge over their competition. Our members use data to help them identify what specific pieces of content are helping them achieve important business goals.
A eCourse case study
In the case below we’re looking only at eCourse sales but we also could just as easily look at a newsletter sign ups (or other important objectives as well). However, for the sake of simplicity let’s focus on the bottom line… eCourse sales.
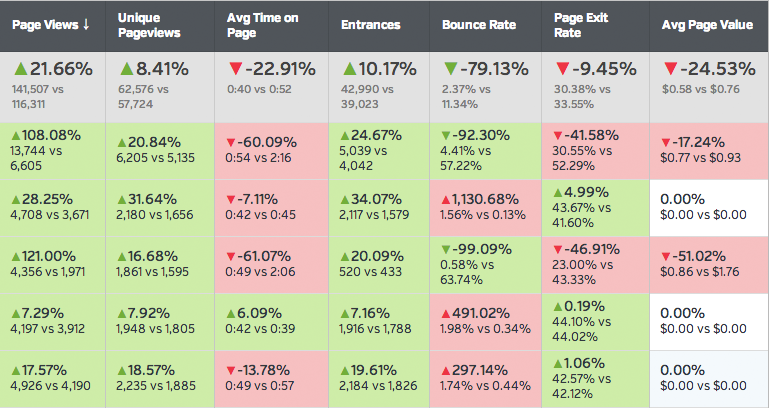
Before we go any further, take a look at the data sheet below. What you see is 6 rows. The top row is the site wide average and the next 5 rows are the data from 5 different pages that were optimized around 5 unique search terms in a specific niche. Pay special attention to the last column in this chart (Avg Page Value). Notice that 3 of the 5 pages have no commercial value at all. Combined, these three pages brought in 13, 867 page views in one month, but this led to no purchases.
What does this data tell us?
This data tells us a lot, but for the purpose of this blog post it tells us that we missed the target on 3 pages. For these three pages our member did their keyword research and picked related topics, but the pages just didn’t impact the bottom line… at all.
Therefore, if we looked at this data without looking specifically at the data related to each individual piece of content then we would mistakingly give sales credit to the average site traffic. Which would be a big mistakes because….
Not all traffic is created equal
If we drill deeper than this we can analyze why some pages under-perform. But first we need to figure out what the problem is. Is it searcher intent? Is it the writing style of those pages? Is there a weak call to action? The list of potential problems can go on and on. However, without this data we can’t ask those questions in the first place.
In many cases we find that although content is created for a specific niche it often doesn’t capture the visitor at the right stage in the buying cycle. Or the content, even though it’s related to your course, might not be tied in close enough to your specific course topic. There are many reasons why a page might under perform. Either way, knowing which pages are performing well and which ones are under-performing is crucial if you plan on running an efficient content marketing campaign for your eCourse.
Content marketing without data can be a waste of time
In the example above we’re just looking at 5 pieces of content, but remember, 3 of them did absolutely nothing. Imagine the time that was used to create those three pages was put into creating 3 pages that converted visitors into customers. That’s why the old adage “if it’s not broke don’t fix it” doesn’t really work in this case. While it is possible to grow an eCourse company without using this data, it’s not the most efficient growth strategy. In the case above, our member spent 60% of their time creating content that gained them traffic, but no sales.
Notice I didn’t use the phrase “wasted their time”. The reason for this is that it’s natural to have pages under-perform. You often have to test out content ideas and that means that you’ll have many failed posts on your site. That’s totally normal. It only becomes a waste of time, if you ignore the data and repeatedly make the same mistakes over… and over… and over again.
So go out there, put your data geek hat on and be an efficient content marketer. Your eCourse sales will tell you how good of a job you’re doing 🙂 Have fun.