eCourse Growth Strategies
Online Course Owners Use These Traffic Sources To Increase Enrollment
Understanding how each of these potential students interact with your website is important because by understanding their behavior you can further refine your marketing efforts. For example, if the visitors referred to you by Facebook are “just looking” you can optimize their browsing experience and introduce soft sells to get them started in the eCourse buying cycle. Or, if the visitors sent to you by referral sites are quick to buy your eCourse, you can optimize the buying process for them and spend more of your time looking for traffic from those sources.
E-COURSE VENDORS: ALL TRAFFIC SOURCES ARE NOT CREATED EQUAL
By gathering this information you can also make informed decisions about where to spend more of your advertising budget and / or time. For example, you might find that you generate the most online course enrollment income from the members who sign up for your eCourse newsletter. But where do the people who sign up for your newsletter come from? Do they come from paid search? Organic search? Referral traffic? Social sites like Facebook or Twitter?
Without this information it’s impossible to evaluate your current marketing efforts and it’s impossible to know exactly how to best spend your precious time and advertising money.
AN ONLINE COURSE CASE STUDY
We deal with many types of clients in a broad range of categories. Most clients who sign up with us to sell their courses online are new course vendors. Most of these educational entrepreneurs don’t even have a website to sell their eCourse from yet. These are our “start-up” clients.
However, we also work with clients who have had online courses up and running for a while, but want to work with us because they want to take their online course company to the next level. These clients are our “turnaround” clients.
Start-up courses and turnaround courses require totally different approaches from our end. A start-up course offers the advantage of being able to build everything properly the first time around. However, it takes them time to get our clients off the ground and selling.
A turnound course on the other hand, offers the benefit of a fully developed course and a built-in traffic base for us to test on, but “turnaround” eCourse sites always come with many broken parts and missed opportunities for course sales and traffic optimization. So it requires a lot more work on our end to fix these broken parts. The particular case study we’re about to look at below is from one of our “turnaround” course clients.
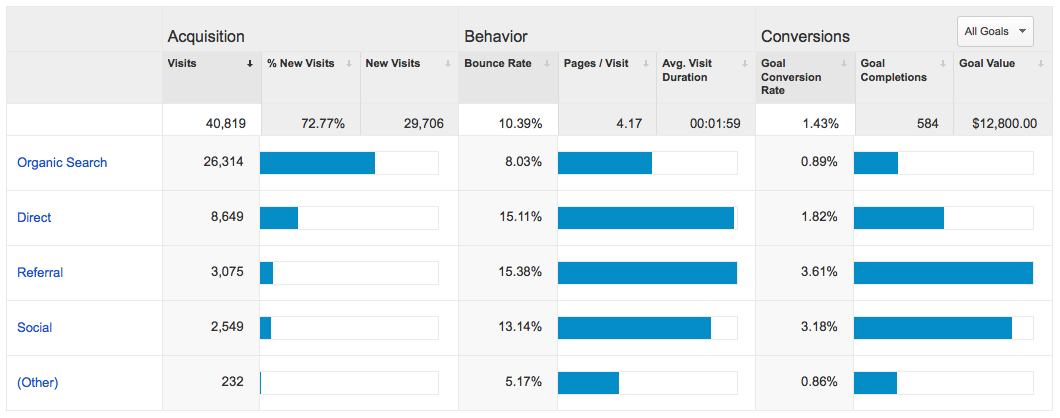
Look below, but ONLY look under the “acquisition” column. You’ll notice that the majority of their online course website traffic came from organic search. When this client first signed up with us they told us that this was the metric they valued most. They valued it because they knew it was a source of a lot of traffic.
However, in the world of selling courses online, quality of traffic needs to be given equal weight as quantity of traffic. Looking at the chart below we can see that 26,314 visits were a results of organic search. Again, just look under the “acquisition” column.
QUALITY ONLINE COURSE LEADS
For the purpose of keeping this blog post focused, let’s skip the “behavior” column. It’s an interesting metric to analyze because it allows you to identify problems and then start down the path to fix those problems. However, this particular metric deserves a topic on it’s own, so for now let’s keep focused on the value of a visitor.
Let’s look to the far right column called “conversions”. Notice the discrepancy between the conversion rate of different sources of traffic. In this case “other” (which includes sources of traffic from things like your site’s RSS feed) scored the lowest conversion rate of .86% and “referral” has the highest CR of 3.61%. Traffic from social sites also had a really high CR of 3.18%.
So should this client go out and spend all of their time and energy on these high CR traffic sources? Maybe… but maybe not. We need to dig deeper. Get your shovels out.
DEFINING GOALS FOR YOUR E-COURSE
The numbers above simply don’t tell us enough. They are too general. We need to know exactly what the conversion rate is measuring. In this case we’re measuring two important metrics. We’re analyzing eCourse sales and newsletter signups. So where it says “all goals” it’s currently measuring the combined CR for those two goals.
However, using the drop down link you can change “all goals” to measure a specific goal within your account. So let’s measure our client’s online course sales first. The results are below.
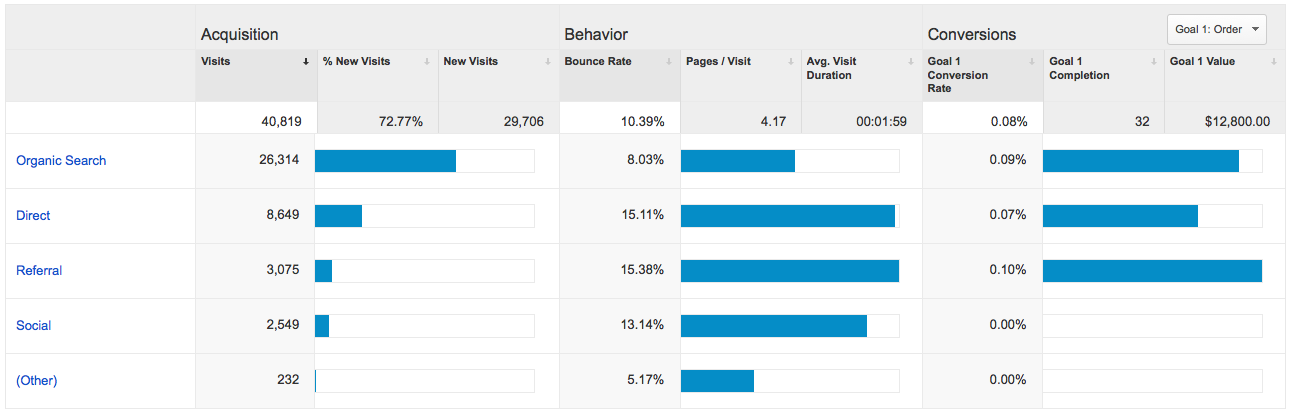
Organic Search: 23 course enrollments (71.88% of all eCourse sales) for a total of $9200 in enrollment income.
Direct: 6 course enrollments (18.75% of all eCourse sales) for $2400 in enrollment income.
Referral: 3 course enrollments (9.38% of all eCourse sales) for $1200 in enrollment income.
Social: 0 course enrollments (0% of all eCourse sales) for $0 in enrollment income.
As you can see, these numbers say something totally different then what we might have observed after looking at the first chart. Before the numbers might have led us to believe we should spend all of our money on referral and social traffic because they convert the highest. Now our numbers are saying those are not as impressive as we might have thought because it was including “newsletter signups” in the conversion metric.
The “social” metric is a particularly interesting metric since only a few minutes ago it was the most exciting metric jumping off the page at us. However, now it’s showing it led to no online course enrollments. Not even one! So does that mean that social traffic is worthless? Should we delete our business Facebook account and stop wasting time on Twitter? No. You’ll be losing out big time if you do. But we need to dig deeper before you understand why.
But first, let’s look at our second goal, which is newsletter opt-ins.
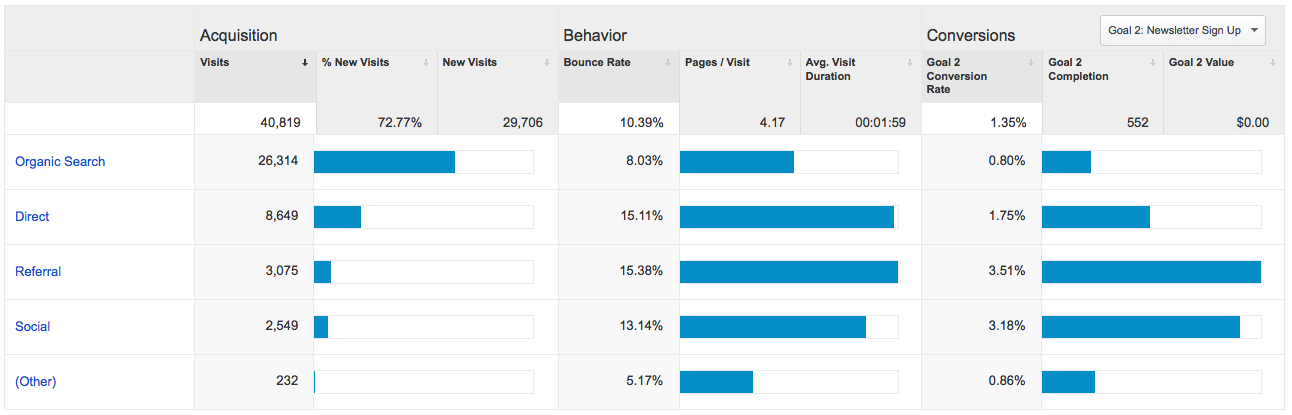
Organic Search: 210 newsletter signups (38.04% of all newsletter signups)
Direct: 151 newsletter signups (27.36% of all newsletter signups)
Referral: 108 newsletter signups (19.57% of all newsletter signup)
Social: 81 newsletter signups (14.67% of all newsletter signups)
Now this is where things start to get really interesting. First of all, we need to ask ourselves: Can we assign a value to this goal? What is the value of a newsletter subscriber? Do they ever buy online courses? Or do they just visit to get free information? Well luckily for you we’ve tested this metric for this online course vendor and we’ve found that the value of a newsletter subscriber is roughly $4.99. You can see the case study where we measured the value of a newsletter subscriber here.
Based on this previous case study we know that a newsletter subscriber is roughly 300% more valuable than a regular site visitor. Signing up for the newsletter was just the first step in the buying cycle. They want to take the online course for a test drive before they commit to enrolling in the paid version of the course. So now all of the sudden social and referral traffic re-gain a bit of importance. If we give each of these signups the value of $4.99 it equals $943.11 in value for a 30 day period. That’s not too bad. Luckily you didn’t cancel your Facebook account!
ATTRIBUTION MODELS FOR ONLINE COURSE VENDORS
This is where things start to get slightly more complex. To base a conversion on one traffic source alone is to oversimplify the process. For example, by default some analytics programs base a conversion off of the visitor’s last site interaction before the purchase. For instance, maybe a visitor has your site bookmarked. Let’s say they go to their bookmarks and they visit your site, and on this day they decide to enroll in your online course. Well in this case, this was the last interaction with your site so “direct” will be given the credit for the sale.
But this doesn’t take into account all of the “assists” that other sources may have had in the buying cycle. For example, how did they find out about your site in the first place? Let’s say a friend of theirs was following you on Facebook and they liked one of your posts. In this case, maybe your new student saw their friends “likes” and decided to like your Facebook page as well. Maybe a week later they visited your blog and read through a few posts. They loved your content, but they still were not 100% ready to sign up. So they bookmarked your site which allowed them to easily come back at a later time. When they did come back, they signed up for your newsletter because they wanted to sample some of your course content. They loved what they received in their inbox and they were almost ready to enroll, but first they wanted to look for third party reviews of your program. So they jumped online and searched online for reviews of your program. Your online course had great student feedback so they pulled up their bookmarks, visited your site and enrolled.
Analytics programs using a “last click attribution model” would give this last interaction (in this case the direct visit from a bookmark) 100% credit for the “goal”. However, the goal would have never been possible if they didn’t see their friends posts on Facebook first. Essentially, using the last click attribution model undervalues the importance of first “touch points”. In this case, social media gets 0% credit for the “goal”. But surely the “assists” should could for something? Right?
Some marketers opt to give the first “touch point” rather than the last “touch point” 100% of the credit. So in the case above Facebook would get the “goal” for being the first source to let the buying customer know about your online course. However, this is problematic as well because it ignores the steps in between. Another blog put it perfectly when the author wrote “First click attribution is akin to giving my first girlfriend 100% of the credit for me marrying my wife.”
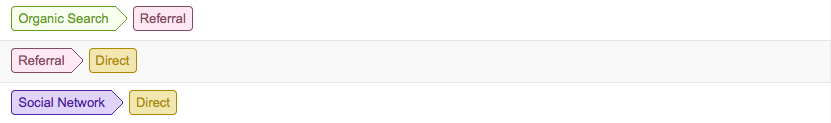
We’ll write a post soon on different attribution models, but it’s important to know that there are options that exist (time decay, position based and custom attribution models) which take into consideration “assists” of other “touch points” in the buying cycle. For example, in your Google Analyitics account you can click on “Conversions” — “Multi-Channel Funnels” and then “Top Conversion Paths” to see a graph which shows the order that visitors found you before they made the purchase.
When you get this far, you need to analyze this data on a case by case basis. You really need to know what your Return on Investment (ROI) is for each eCourse marketing activity you’re engaging in.
The main takeaway for Course sellers is to use your shovels to dig deep into your data. The worst thing you could do is to glance over your analytics data and make decisions that would have you scrap activities that aren’t “scoring goals”. On the surface that may seem like the right decision, but if you take the time to dig deeper you might see that those activities are great team players and lead to many assists.
We hope you found this case study valuable.